


For any ecommerce business, it’s impossible to know what’s working and what isn’t without the help of a robust analytics program. Problem is most out-of-the-box analytics platforms are built for website measurement, analyzing surface metrics like pageviews, time on page, bounce rate, and exit rate.
These are all important metrics for your business. But ecommerce websites are different. If the goal is to understand where you can improve your sales funnel, you need to see your customer journey from end-to-end and break down elements of your web traffic that are specific to ecommerce sales.
Google Analytics Enhanced Ecommerce does exactly that. It’s a program custom-built just for online stores like yours, a powerful tool for understanding what you could be doing to make more sales. It doubles the power you get from the basic Ecommerce Tracking set up, giving you access to more in-depth analyses around product, checkout, sales, and visitor behavior data and empowering you with insights you can use to improve your shopping experience.
Your business is only as robust as the tools you use to keep it running smoothly. Ecommerce Tracking is a good start for the data-averse, but you can’t take your store to the next level without Enhanced Ecommerce.
In this article we cover the key benefits, how to implement it on your website and the valuable insights from the enhanced ecommerce reports.
What you can track with Enhanced Ecommerce
Though you can get surface information and some insights with Ecommerce Tracking, Enhanced Ecommerce opens you up to a world of analysis, helping you pinpoint where your site performs well and, more importantly, where it goes wrong.
Here are a few of the ways Enhanced Ecommerce ups the game on your analytics tracking.
- Measure the customer journey from end-to-end.
The best data analysis tells a story. But not all of us are analysts, which is why it’s extremely difficult to understand the path a customer takes from purchase consideration to buying from your store. Enhanced Ecommerce tees up the analysis for you, showing you which elements of your website perform well with customers and which elements could be improved upon.
Having this kind of detail also allows you to isolate elements of the journey. Enhanced Ecommerce includes deep-dives into the checkout process, highlighting how and why cart abandonment happens most often on your store. You can use this insight to convert more lost sales.
- Discover deep product and sales insights.
With Enhanced Ecommerce, you can dig deep into sales performance metrics like top sellers and order sizes to understand more about how customers interact with your store and how you can get more out of each sale. You can also see where you’re doing a good job optimizing product placement -- where products perform best on the page or how to present them to drive more sales.
You can also analyze post-sale data. Reporting on refunds and returns, for example, helps you understand which products may be lower quality. The results here can also help you plan your refund and return program and help you make more accurate revenue projections in the future.
- Get information on your marketing programs.
The health of your marketing is core to what you can measure with Enhanced Ecommerce. You can get granular with lead generation, for example, with in-depth referral analysis.
Promos are another area a more strategic approach can greatly enhance your bottom line. You can use Enhanced Ecommerce to dig deep into how your coupons and promotions perform, giving you the insights you need to optimize this area of your marketing.
Content is a key feature of your marketing program and an often overlooked part of online store measurement. Enhanced Ecommerce gives online store owners the ability to track content inside and outside of your website, from your blog to your social media channels. Understanding where you can optimize content is a huge advantage for your business.
How to implement Enhanced Ecommerce in your store
Some shopping cart software platforms have Enhanced Ecommerce natively integrated into their backends. This greatly simplifies the process of getting set up with the tool. If your platform doesn’t include native functionality, don’t sweat it. Implementation will just require a bit of coding elbow grease.
Here’s a step-by-step look on how to manually get up and running with Enhanced Ecommerce.
- Ensure you’re using Universal Analytics.
If you haven’t already, upgrade from Classic Analytics to Universal Analytics. On the “Admin” tab in the “Property” column, click “Universal Analytics Upgrade.”
- Add Enhanced Analytics tracking to your store.
If you aren’t already using Google Tag Manager, you’ll need to add the ec.js tracking code on every page of your online store. This process is much simpler with Tag Manager. Just go to your tag editor on Universal Analytics and turn on Enhanced Ecommerce for the relevant tags.
Without Tag Manager or development experience, adding the code can be tricky. It’s worth hiring a developer for the project to make sure everything’s done correctly.
- Turn Enhanced Analytics on.
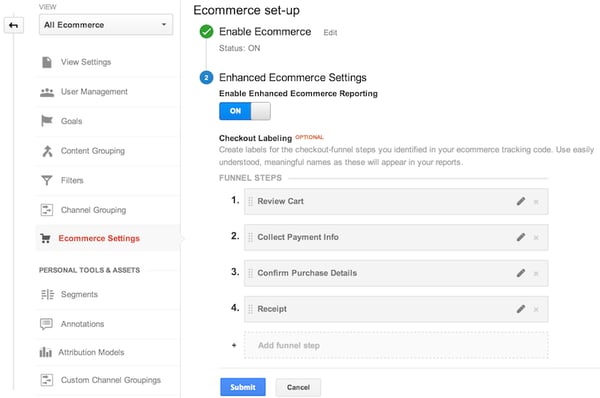
Open Analytics and go to Admin > View > Ecommerce Settings to turn Enhanced Ecommerce on.
Interpreting Enhanced Ecommerce reports
It’ll take some time before you have useful data. Once you do, you can start to peruse your Enhanced Ecommerce reports for insights.
You don’t need to be a data analyst to interpret the reports you’ll get with Enhanced Ecommerce, but it doesn’t hurt to have some idea of what you’re looking at. Here are a few of the most useful reports and how to interpret them.
Overview
As the name suggests, this report gives you a bird’s eye view of the health of your business, consisting of four main areas.
- Revenue and conversion rates show you the dollar amount of products you’ve sold and the percentage of visitors who’ve bought something from your store.
- The transactions section details how many purchases have been made on your store and the average order value.
- The marketing report gives you a quick breakdown of marketing campaigns on your site and on outside properties.
- Top sellers shows which products, categories, and brands contribute most to your bottom line.
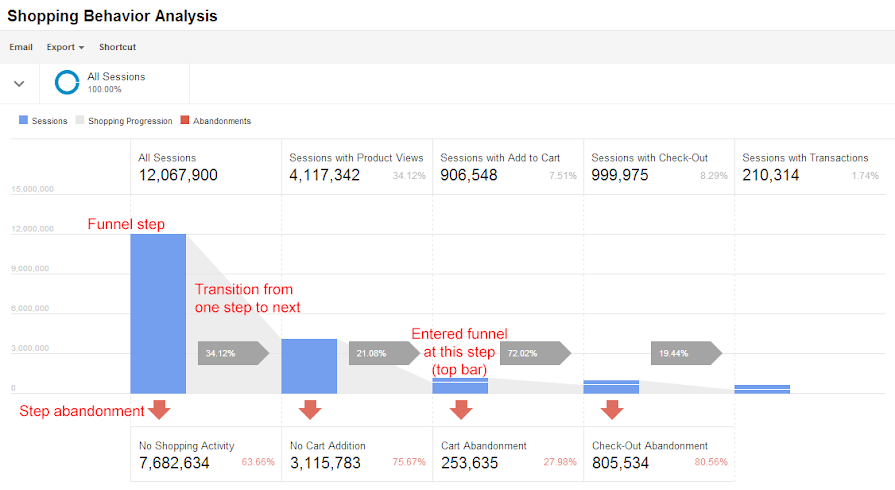
Shopping Behavior
Here you can follow the typical customer journey through the phases of the purchase funnel, beginning with site visitors and including visitors who looked at products, added products to their cart, started to checkout, and actually made a purchase. If you’re losing a lot of people at specific stages of the funnel, this is a good indicator you can work to improve this part of the customer journey.
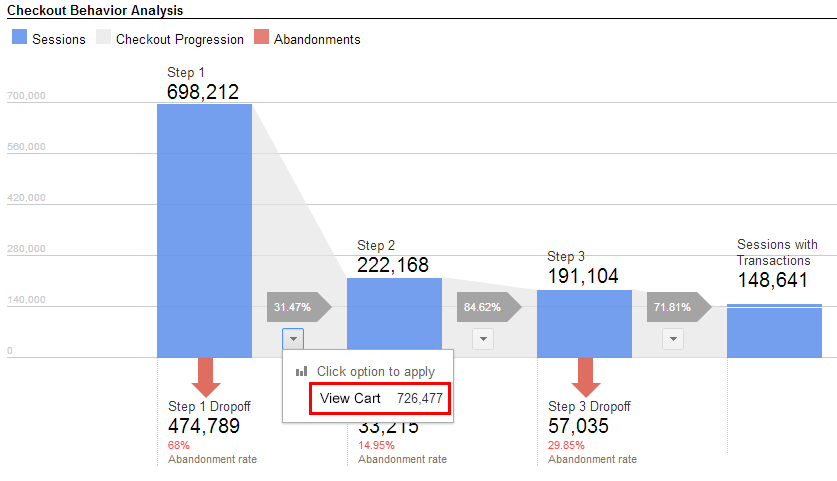
Checkout Behavior
Similar to the Shopping Behavior report, this report gives you a step-by-step breakdown of which step of the checkout process you’re losing customers. This kind of analysis shows you where to optimize the process to stop cart abandonment before it happens.
Product Performance
This report gives you a high-level view of product performance based on a number of dimensions. Perhaps more useful is the ability to split shopping behavior by product dimension, creating a filtered view into shopping behavior that can yield insights about product descriptions, images, and more.
The Product performance report includes 2 views:
Summary View: In the summary view you can see the following metrics
- Sales Performance
- Product Revenue (revenue from individual product sales)
- Unique Purchases
- Quantity (number of units sold)
- Average Price (average revenue per product)
- Average Quantity
- Product Refund Amount (amount returned to users as refunds)
- Shopping Behavior
- Cart-to-Detail Rate (number of products added per number of product-detail views)
- Buy-to-Detail Rate (number of products purchased per number of product-detail views)
Shopping Behavior View: This view includes the following metrics:
- Sales Performance
- Product List Views
- Product Detail Views
- Product Adds (to carts)
- Product Removes (from carts)
- Product Checkouts
- Unique Purchases
- Shopping Behavior
- Cart-to-Detail Rate (number of products added per number of product-detail views)
- Buy-to-Detail Rate (number of products purchased per number of product-detail views)
Sales Performance
Your Sales Performance report is a good place to make sure you’re optimizing your product pricing. Here you can get detail on shipping costs, taxes, and other information that factors into your bottom line.
The report includes the following metrics:
- Revenue (total revenue from ecommerce transactions; depending on your implementation, this can include tax and shipping)
- Tax (total tax charges for ecommerce transactions)
- Shipping (total shipping charges for ecommerce transactions)
- Refund Amount (Currency amount refunded for a transaction)
- Quantity (number of units sold in ecommerce transactions)
Product List Performance
You can create product lists to see related products grouped together from a data perspective. For example, you may want to see data about a group of products you ran a specific marketing campaign for.
The metrics available on this report include:
- Product List Views (number of times users viewed products when they appeared in the product list)
- Product List Clicks (number of times users clicked products when they appeared in the product list)
- Product List CTR (the rate at which users clicked the product list to view products (number of clicks divided by the number of times the list appeared)
Marketing
Metrics regarding promotions, coupons, and codes are all listed in the marketing section. You can use this data to see how different campaigns are performing and decide which ones to keep and which ones to axe.
The marketing section includes multiple reports:
- Order coupon report
- Product coupon report
- Affiliate code report
Conclusion
If you want to continually improve your online store, you need the data to back up your decisions. Google Analytics Ecommerce Tracking is a step in the right direction, but Enhanced Ecommerce makes fixing problems in your pipeline practically automatic.


Leave a reply or comment below