

With thousands of other websites as competition, many site owners are constantly looking for the next opportunity to stand out. It isn’t just a matter of showing off what they can do, but more a matter of making the sales they need to keep their site (and business) running. Heatmaps are an often-overlooked tool that can have a tremendously positive impact on your sales.
Before we get into exactly what heatmaps are and how they can help, take a moment to look at how you monitor the performance of your website currently. You most likely have some form of analytics set up on your site, perhaps Google Analytics, and you track how many visitors you get to your site over time.
This in itself will allow you to track trends. Perhaps your site is busier in summer or around the holidays. Knowing this regular cycle helps you to prepare, but it doesn’t increase your sales potential.
With a service like Google Analytics, you can track the progress of visitors through your site. You can see what page they initially land on, and which page they exit the site from. In some cases, you can guess why they left, but there is no data available that allows you to infer what really happened through human response.
You need to find out which part of your website is blocking the process of converting a visitor into a customer, and you need to make changes to your site to facilitate this process. Only knowing how visitors interact with each element of your site will make this possible, and heatmaps are the most effective tool for providing this information.
What Is a Heatmap?
Heatmap software is used to track how a user interacts with a website. This includes how long a page is kept open, how soon scrolling begins, and what buttons or links are clicked.
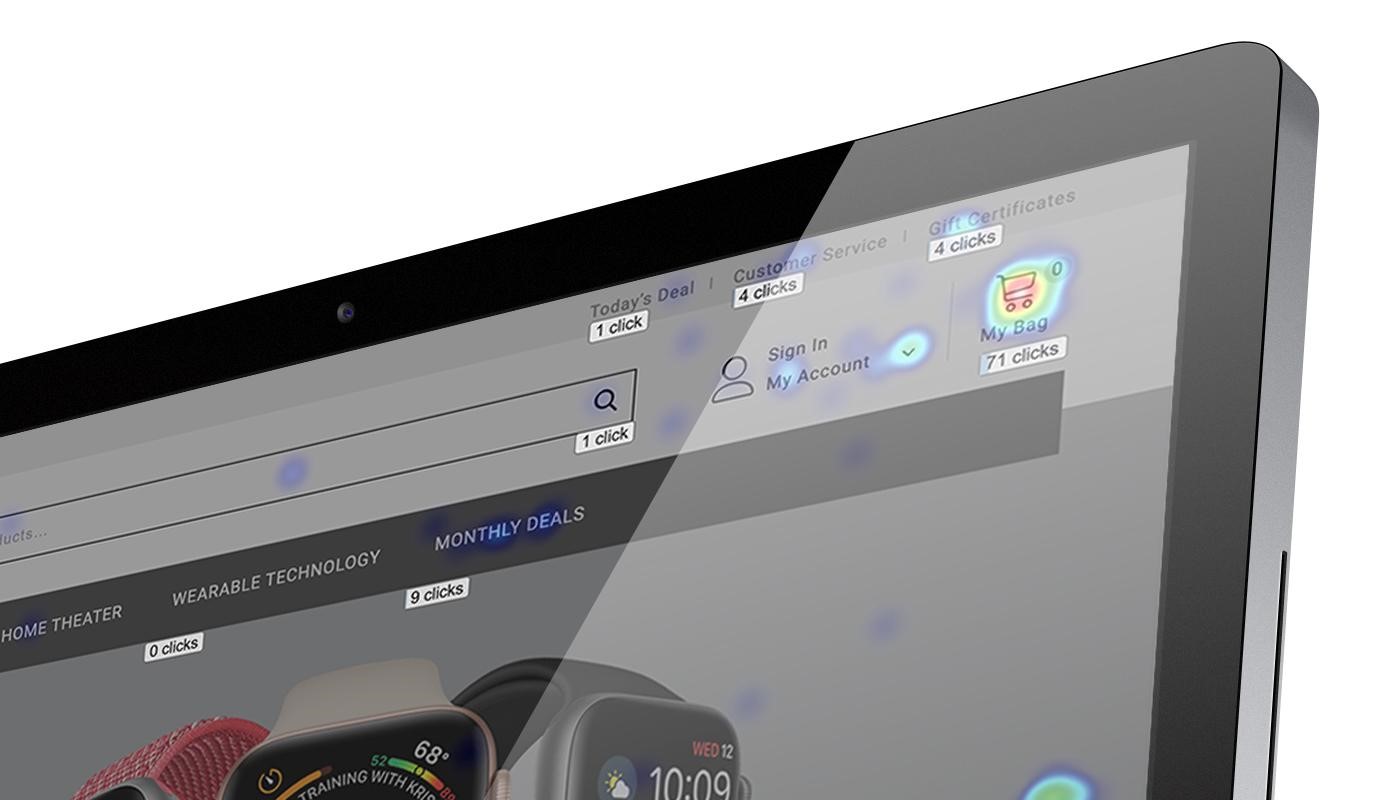
More importantly, a heatmap is built by tracking where a mouse pointer moves and hovers, or in the case of a touchscreen device, where the finger touches. The heatmap that is generated by heatmap software will show more intense colors in the areas where higher attention is focused.
As an example, if a site has two buttons, and button 1 is clicked 10 times while button 2 is clicked only once, the heatmap will show the area over button 1 to be a much more intense color than over button 2.
When this heatmap is generated with data including page scroll rate, you will quickly see which parts of your site attract the most attention, and which sections are relatively ignored.
Here are five ways that heatmaps can help you boost sales through your website.
1. Find the hotspots on your website.
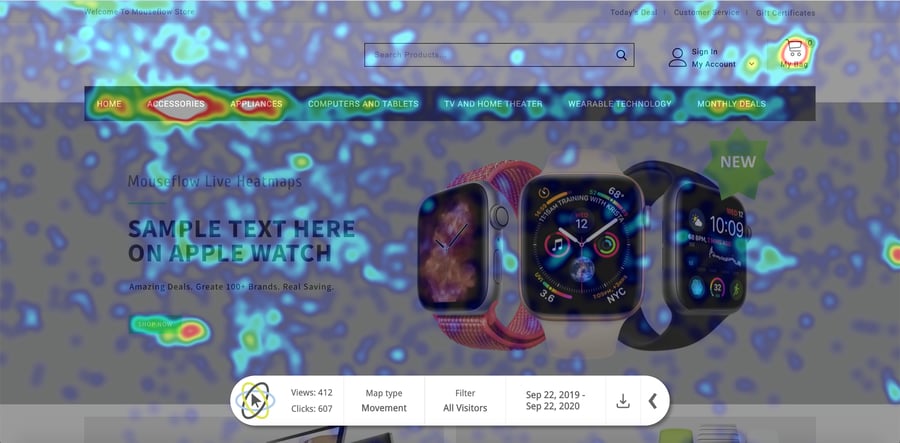
Source: Mouseflow Live Heatmap tool
The two main parts of any online presence are content and design. You can have the best content in the world, selling products at exceptional prices, and still not make a sale. If your site is poorly designed, it may be difficult for visitors to find the “buy” button, and therefore it is unlikely that they will convert into customers.
While in most cases the problem isn’t this extreme, how your website is designed will affect how visitors interact with it. Heatmaps will allow you to identify the areas that grab attention.
The layout of the site is an extremely important factor. For many years, the publishing industry has understood the impact of page layout – placing an advert on the right-hand side of a newspaper will cost more than the left-hand side, with the highest priced advert slot being at the top right of the front page. This is due to the way that people read, starting from the left and ending at the right, which means that most people spend more time looking at the right-hand side.
With mobile design trends coming to the forefront, the left/right paradigm is slightly less relevant than vertical scrolling. However, you won’t truly know how the design of your site impacts users until you see a heatmap that tracks real-world interactions.
Discovering where people click and focus their attention on your page will give you opportunity to improve its overall design. In short, if most users focus on what you consider to be the “wrong” button, change the location of the “right” button to be in the area of focus.
2. Find deeper insights on how your site is used.
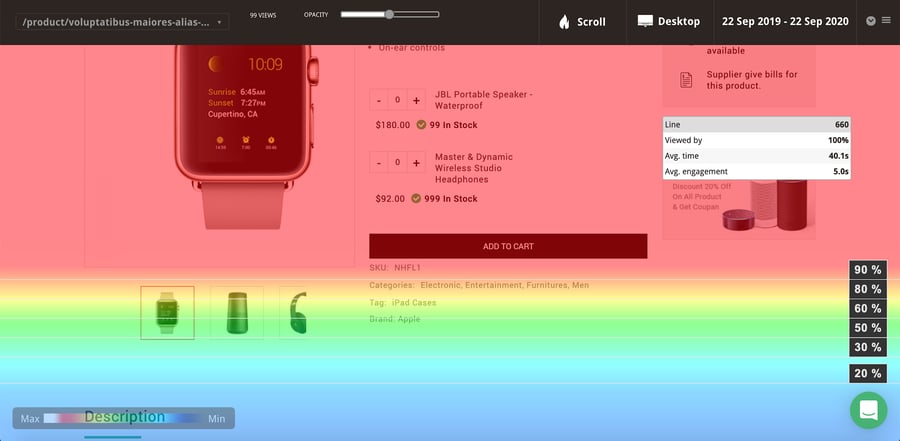
Source: Mouseflow Scroll Heatmaps
Tracking clicks and how they relate to design will give you an advantage over your competitors. However, as users go through your page, there are common traits that can give an even deeper understanding of site usage. As the page is scrolled through, there will be places where the scrolling pauses. This is because something has caught the attention of the visitor.
With a computer or laptop using a mouse pointer, the pointer often tracks where the visitor is looking. As they read through text the pointer will follow their eyes. When something highly relevant is found (or something that needs thought), the scrolling and the mouse pointer motion will pause.
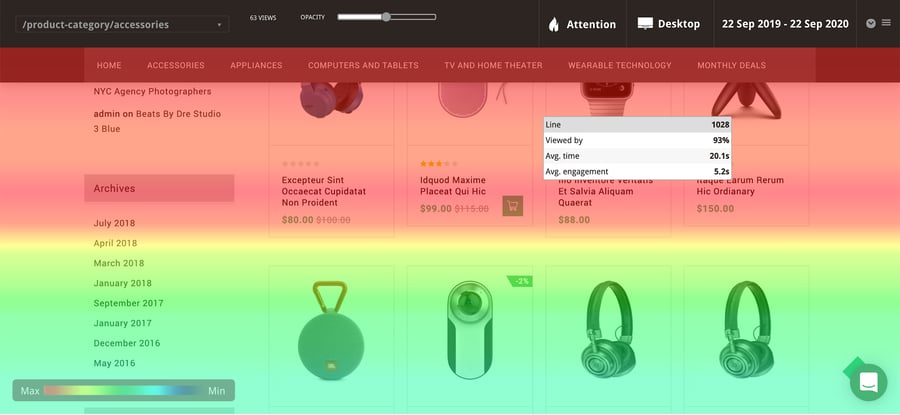
Source: Mouseflow Attention Heatmaps
Analyzing why these areas are focused on can boost your sales. If one page converts well and other pages don’t, you’ll need to mirror the high-performing page throughout the site. But if the page doesn’t convert, you’ll be able to see which part of the page was reached before the visitor left.
If they leave consistently when they see the price, it may be more than the design you need to look at. However, if they scroll right to the bottom of the page, and then scroll back up, and then circle a few times, you might wonder if they are having trouble finding the “buy” or “add to cart” button. A key indicator is if the visitor finds the price, and then hovers slightly below and to the right of it, clearly looking for a button to press.
As noted above, the right-hand side is the prime area for content that you want to be noticed, but keep in mind that in Japan and other countries, the opposite is true as the text is read from right to left. If your “buy” button is hidden away on the left side of the page, it may be missed.
This works consistently throughout your website, as heatmaps will allow you to see the places where visitors looked for a button or link but couldn’t find one. In your shopping cart process, you will also be able to see what stops people from buying. By this stage, it is unlikely to be the product cost. It may be a complicated interface, added fees and shipping costs, or even the lack of a particular payment option.
3. Compare how design changes affect your visitors’ behavior.
Using traditional analytics will give you figures that show the number of visitors you attract, and you’ll be able to see if there’s a difference when you change your design. However, you won’t be able to see how your visitors’ browsing behavior has changed.
Comparing historical heatmaps with heatmaps for your new design will help you to visualize how visitors have responded to the changes you have made. They may click or hover in different areas, focus their attention on different parts of the page, and overall have an entirely different experience using your site.
While the numbers provided by analytics are important overall, click and hover heatmaps will show if the changes you have made have an impact on where users interact with the site. Once you’ve determined if the changes have had a positive or negative effect, you can commit to keeping them or reverting to your previous design.
It is entirely possible to get a higher number of visitors with a lower number of sales, or vice versa. What is important is being able to spot the difference that the changes have made through the use of heatmaps
4. Find areas of your site that are ignored.
There may be sections of your site’s pages that people simply skip by without reading. This could be a picture, an infographic, or some information that may lead to them purchasing from you. With heatmaps, you’ll see which parts of your page get less attention than others.
Heatmaps allow you to form an understanding of how a page is used. If the important parts of the page are skipped, you’ll need to make some changes.
This kind of analysis leads to a better overall page design that converts more readily than before. The benefits of this kind of tracking are clear, for even if the area that is ignored is an advert for another product rather than a direct conversion opportunity, you may be missing out on sales because that advert has not been seen.
5. Make sense of your analytics.
Heatmaps are not a replacement for analytics, but instead enhance the opportunities you have to understand customer behavior. Analytics can show the raw numbers. For example, 1000 people may visit your site every day – but, when only a small percentage convert to customers, it may be unclear as to why that is happening.
You can certainly identify pages where visitors leave, but it won’t be clear why they left. Understanding how your visitors scroll through and use your site can give strong indications of why conversions aren’t higher.
Even heatmaps generated by the interactions of a handful of human visitors will enable you to see where the pressure points in the site are. You can find the answers to questions like:
- Can users find the options they need to click?
- Are buttons easy to find?
- Do visitors quickly scroll by images, or do they pause on images of a certain size, shape, or color?
- Are there certain areas of text they linger on and then leave?
- Perhaps some text is carefully read right before a purchase is made – what can you do to replicate this interaction in other areas?
Analytics and other statistical measurements are vital to tracking the overall success of your website, but without heatmaps, you will struggle to appreciate how users interact with your content. No two users will interact identically, and the designers, coders, and owners of a website will use it in an entirely different way to a visitor because they know the site already and understand the expectations of how it is to be used.
Your visitors will have no such inside knowledge, so using heatmap software can be the difference between making a sale and losing a lead forever. It always pays to know how your visitors use your site.
Conclusion
Heatmaps provide valuable insights into how visitors interact with and use your website. Optimizing a site for human use without heatmap software is almost like working in the dark as you cannot see real-world examples of how your site is used.


Leave a reply or comment below