


Ever wondered why you’ve never seen a large business such as Old Navy run the same promo twice in a year? Each of their marketing emails has a different offer.
Old Navy understands the value of measuring the success of campaigns accurately and quickly while tying them in tightly with daily and overall sales objectives.
To stay on top of the game, it is essential to understand and learn whether marketing and promotional tactics fulfill their purpose.
Below are a few tips and metrics – along with formulas – to help you calculate, track, and monitor some vital measures of success.
Why You Should Be Measuring Your Success
Any project or marketing campaign needs to define success long before the cogs and wheels are in motion. It gives you a sense of how your business is growing and pins down gaps in customer service and online purchase journeys that need immediate attention.
Here’s a list of tips to help you along the way and get the insights you need to set up for success.
Tips to Measure Your Success More Effectively
Set Goals and Timelines
When a new, exciting idea takes root, it can be tempting to jump head-first into working on it right away. Take a step back and put in the time to lay out goals and timelines to keep everyone involved in the project on track.
On a monthly, quarterly, or even weekly basis, you can set OKRs (Objective Key Results) to help visualize goals and track them appropriately.

A few good questions to help kick those brain cells into action are:
- What are you looking to achieve?
- What indicators will determine the success of this idea?
- How long will it take to achieve results?
Maintaining momentum is crucial to measuring the effectiveness of marketing efforts.
Identify Your KPIs
Marketing campaigns are incomplete without a list of measurable KPIs (Key Performance Indicators) as part of your project plan. Often, project leads will put this section up for discussion towards the end of the planning stage.
For example, your campaign goal is to increase app installs and raise brand awareness through a coupon-code offer where people get an extra percentage off when they buy through the app. However, you find out later from the Development team that your app is not set up to track coupon code usage. There goes your idea!
That being said, it is easy to get lost in a rabbit hole of metrics available on monitoring tools. Do you need to track the average number of add-to-baskets? How helpful is the page-depth metric?
Here is a good starting point for setting KPIs at each stage of a sales funnel:
Awareness
- Impressions
- Organic website traffic
- Online mentions
- Video views
- Search volumes
Perception
- Brand lift surveys
- Sentiment analysis
Consideration
- Total traffic
- Leads generated
- Average time on site
- Social media comments
- Clicks on ads
- Add-to-carts
- Abandoned carts
Decision
- Purchases
- Qualified leads acquired
- Conversions
Post-purchase experience
- Product experience survey
- Customer experience survey
- Reviews and testimonials
- Returns and exchange initiations
- Follows and likes on social media pages
Leverage the Right Tools
Imagine you have set up a microsite for a massive lead generation campaign that invites people to a VR musical performance if they download your app. Weeks later, when the campaign is wrapped up, and you ask the digital marketing specialist for data on traffic and engagement, you find out that the site tracking tags were non-functional throughout the campaign run.
What’s that sound?
It’s the sound of heartbreak from losing all your data.
Once you have identified the main KPIs, check if your monitoring tools are capable of tracking them. Check what you need to ensure they are being tracked accurately and data is being captured reliably.
When data is captured accurately and reliably by leveraging the right tech tools, you can supercharge the productivity and effectiveness of the entire campaign team.
For example, to track a microsite in Google Analytics, set up a separate view with a filter to capture data exclusively from the sub-domain.
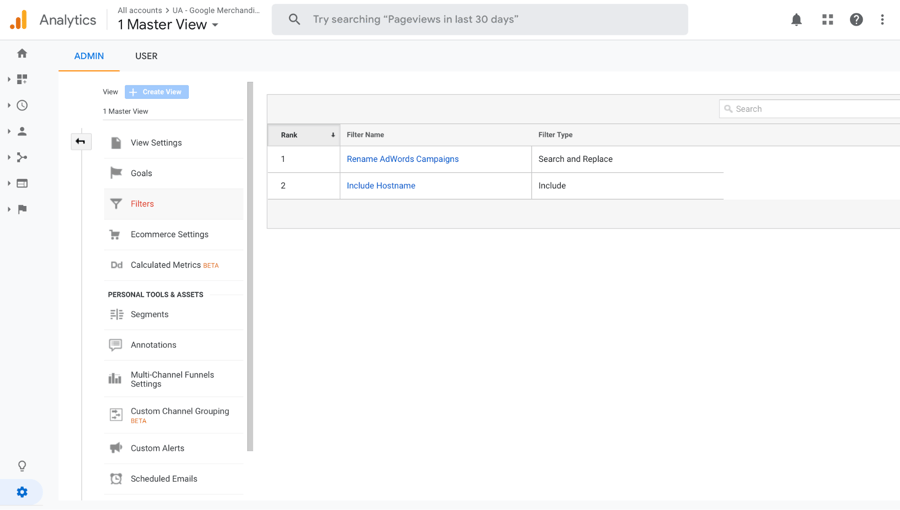
This could further include setting up conversion tracking, placing tags and pixels.
Factor in the Real ROI
Quite often, entrepreneurs limit themselves to measuring RoAS (Return on Ad Spend) and consider that a good proxy indicator of real ROI.
A successful marketing campaign has an incredibly hardworking team of strategists, managers, and creatives behind it. By factoring these resources in the ROI calculation, you make sure that you are not overlooking the real investment that went into building a marketing campaign.
A keen understanding of your business’s sales funnel and purchase funnel will iron out many of these details.
For example, Orolay - a brand that sells folding chairs - achieved overnight success when a cheap coat sold by them on Amazon was picked up by fashion-savvy women of Upper Eastside in New York. Publications and various influencer pages picked up on the trend, and the next thing you know, Orolay transformed from a furniture brand into an apparel brand. Their purchase funnel morphed entirely. They scaled up quickly to meet the demand for what’s now remembered as “the Amazon coat” because they closely monitored trends and sales using Amazon’s offering of e-commerce tools.

Transform Data into Valuable Insights
Numbers, numbers everywhere. But not a drop of insight to see.
While that’s not exactly how the popular expression goes, it can certainly feel that you are churning out reports that lack effective data storytelling appeal.
Storytelling using data is a skill that can be learned and possesses the potential to transform your organization’s reporting process.
After you have pulled reports from a sales monitoring tool such as Salesforce, Google Analytics, or Google 360, go back and search for patterns, insights, and trends to try and find a story it tells. This can help you better understand and strategize your sales process.
Key Metrics You Should Be Measuring
You thought you left math in school, but here it is again in the form of campaign metrics you should measure as a yardstick to define success.
Return on Investment
The most common metric used to determine the effectiveness of a marketing campaign – or any project for that matter – is ROI or Return on Investment.
It is one way to measure the sales or fundraising revenue (for non-profits) earned on each dollar spent on a campaign.
ROI = ((Total revenue earned – Total Marketing Cost) ÷ Total Marketing Cost) x 100
Use this formula to measure the quality of leads by assigning a value to each lead generated. If the campaign generated 500 leads and each is worth $100, then the revenue earned is $50,000. At a campaign cost of $1,000, the ROI calculation would look something like this:
ROI = (($50000 – $1000) ÷ $1000) x 100 = 4900%
The campaign earned 4,900 times you spent on putting it together, so your return on investment is 4,900%.
Redemption Rate
Coming back to the example of coupon code usage, a reliable measure of success is to check how often a coupon was used as part of a promotional effort. Did the promo offer of $200 off on over $500 purchase drive people to spend more? Here’s how to find out:
Scenario: If the coupon code "BANANA200" was redeemed 750 times and customers opened the promo email 4,000 times.
Redemption rate = (No. of times a coupon was redeemed ÷ No. of people who saw the promo) x 100
Now, here’s the example:
Redemption rate = (750 ÷ 4000) x 100 = 18.75%
This shows that your marketing campaign had a redemption rate of 18.75%. Redemption rate can help measure the effectiveness of your email marketing campaigns and help devise tactics to effectively reactivate dormant customers.
Conversion Rate
While this is calculated using the same formula as redemption rate, you need to tweak the terms a little to fit the description.
Instead of using the times that coupon and promo codes were used, insert the number of transactions while keeping the rest of the formula the same.
Conversion rate = (No. of transactions on the website ÷ Total traffic during the campaign period) x 100
If during a spring and summer season apparel launch, the total number of sales on the website were 1,000 and a total number of visits to it was 5,000, then the conversion rate will be:
Conversion rate for spring-summer launch = (1000 ÷ 5000) x 100 = 20%
The campaign to promote the launch of spring-summer apparel converted at a rate of 20% on the website. If your conversion rate is low, you can look at A/B testing new call-to-action text at several customer touchpoints to optimize it.
New Customers from Promotion
During promotional campaigns, most businesses maintain their focus on developing promotions with the intent of retaining customers.
There’s only a 60-70% chance of selling to an existing customer through an email campaign. Therefore, it is essential to track new customers to measure two things:
- What kind of messaging is best at encouraging shoppers to buy?
- Do you need to improve customer service to appeal to new customers?
Once a pattern starts to emerge, you can build personalized campaigns for new users, which will eventually supercharge the overall campaign ROI and conversion rate.
Here is how to calculate it:
% New customers from promo = (Number of new customers who have never purchased with you before ÷ Total number of customers in your database) x 100
Obtaining this data takes a bit of legwork. A helpful practice is to tag marketing campaigns with UTMs and identifiers to classify them separately in data reports.
This way, when someone who has never engaged with your business purchases on your website, you can compare which marketing campaign was effective in attracting them.
New Customer Lift
New customer lift helps re-evaluate an old benchmark and set a new one for similar future campaigns and provides a baseline for whether you are on track to achieve your goals using current marketing tactics.
% New customer lift = ((Observed new customers – Benchmark) ÷ Benchmark) x 100
Assuming you usually acquire 20 new customers during a promo campaign and this time you observed 25 new ones, then the % overall lift in new customers is:
% New customer lift = ((25 – 20) ÷ 20) x 100 = 25%
This metric shows that the campaign resulted in an overall 25% lift in new customers.
Customer Lifetime Value
Products and services that rely on repeated purchasing behavior should be measuring and tracking this metric to determine the value of each customer on file. The data takes more than a couple of years to compile and truly become of any utility.
Customer lifetime value = Average Sale per customer x Average number of times a customer purchases per year x Average retention time in years
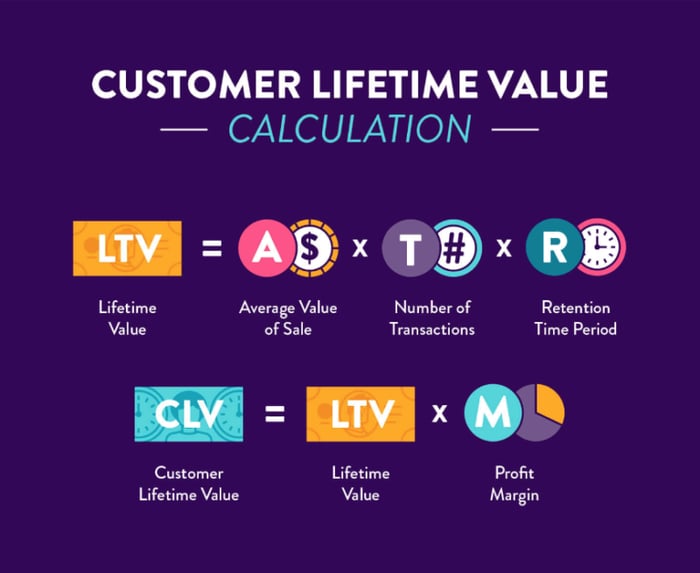
Lipsticks are an excellent example to illustrate how to calculate customer lifetime value.
Say the average sale per customer at your e-commerce store is $50, and they buy on average four times a year. On average, a customer continues buying from you for at least three years.
CLV = $50 x 4 x 3 = $600
Each customer who buys lipstick even the first time from a brand is worth $600 on average.
Sales Lift
If you have benchmarked sales, measure the overall lift in sales during the campaign promotional period using the formula below.
% Sales lift = ((Observed Sales – Benchmark) ÷ Benchmark) x 100
During a Mother’s Day promotion, say you observed 50 sales when, on average, your site shows 20 sales every month.
% Sales lift = ((50 – 20) ÷ 20) x 100 = 150%
Impressively, the Mother’s Day promotion resulted in a 150% lift in sales, proving the promotional strategy worked to boost sales.
Site Traffic Lift
Site traffic lift is useful for brands that employ a combination of multi-channel tactics to measure a promotional campaign’s success.
% Site traffic lift = ((Observed Site Visitors – Benchmark) ÷ Benchmark) x 100
Monitoring a lift in site traffic provides visibility into many aspects of a campaign.
Are you driving more people to the website?
Is the campaign working in bringing back people to the website?
Make a note of tracking this metric when you are thinking of spending more on public-facing tactics like Facebook and Google ads. Building a fast, low-friction, and easy-to-navigate website is proven to boost site lift percentage.
Measuring Done Right: Cases to Inspire You
The best way to learn is by looking at the success stories of those brands that have done it right. To inspire you, here are a few insights from industry experts that will drive your own promotional campaign’s metrics!
Foundation, Ross Simmonds
Ross Simmonds, the founder of the B2B content marketing agency Foundation, shares the importance of measuring web traffic across several channels.
“We often will start by looking at the ways in which certain assets are generating traffic today (i.e. organic) and then after implementing a distribution strategy, look at how other channels start to perform once we start to distribute that content in these new channels,” says Ross.
For example, if Foundation were to leverage subreddits in their content distribution, they would keep track of how much traffic is going to that particular content from Reddit.
By keeping track of channel-specific metrics, they can determine how each is impacting the overarching goal of their campaign.
This was especially helpful during the development of their website.
“We ran an analysis of the top marketing blogs in the industry to better understand what type of content was generating backlinks. We realized quickly that content compiling stats, research, reports, and facts were generating a lot of backlinks and decided to invest similarly into this type of format.”
By doing so, Foundation’s content has ranked on the first page of Google and they’ve generated hundreds of thousands of visits to their site in the months that followed.
What can be your takeaways from their success?
- During content distribution, it’s essential to understand where your ideal audience is spending their time. Foundation leverages tools such as BuzzSumo, SparkToro, and SimilarWeb for this purpose.
- Reverse-engineer your best performing content across other platforms and re-implement your successful strategies in the future.
- Keep track of KPIs that are relevant to your goals like how Foundation keeps track of their content assets that are generating the most returns. For example, Foundation tracks their backlinks. What are your content assets?
SalesHacker, Colin Campbell
At SalesHacker, a community and platform for B2B professionals to grow, success metrics go beyond the norms of reach, adoption, and engagement. Their favorite measure of success is one that is tied to the core functioning of their community and measures how well they’re using the network effect.
“Our strategy is to optimize for ‘thank you's’ we receive when we promote something. For example, when we send our Sales Hacker Weekly on Tuesdays, we almost always hear back from subscribers telling us exactly why they liked one specific part of the content,” says Colin Campbell from the Revenue Operations team at SalesHacker.
SalesHacker does not shy away from using more challenging metrics, especially if they provide meaningful results. Here’s why they opt for this metric:
- It forces them to focus on things they know their audience actually wants and drives campaign strategy.
- It motivates the team and helps people grow.
- It helps differentiate and allows them to measure on unique metrics compared to competitors.
- It provides more meaningful and actionable qualitative feedback than a simple analytics dashboard.
- It provides an always-on pipeline for case studies and testimonials.
With SalesHacker, the “thank you” metric was immensely successful and showed results. When hosting a workshop on Objection-Handling, one of the attendees followed up with Colin afterward and gave feedback on how the workshop was of higher quality than presentation-based training and getting help on LinkedIn.
The SalesHacker team discussed this feedback as a group and ideated on how they could make the best of this valuable insight.
“One idea was to offer on-demand training. Another idea was to build an interactive community of B2B revenue professionals on SalesHacker.com and allow people to ask the questions that they couldn't ask elsewhere, and get answers from experts.”
To put their campaign to the test, SalesHacker surveyed its user base, built the community, and after a year, amassed 16,000 members!
How did they successfully build the community? The “thank you” metric played a huge role.
“Along the way, all the thousands of little decisions we made were guided almost entirely by ‘thank-you’s’,” says Colin.
So, what can you take away from SalesHacker’s success metric and strategy?
- Create metrics that rely on your company culture and are not exact imitations of the industry or competitor’s metrics.
- Communicate with your team and keep them motivated – your campaign performance does not just come down to numbers but also your sales team’s morale. Help them feel empowered.
- Don’t forget to consider qualitative feedback and plan on how to put your insights into action.
Make the Best of Your Metrics
In the digital age, businesses have access to a treasure trove of data that can be useful and overwhelming depending on how you approach it. Several reliable and inexpensive tools exist to monitor the results of promotional campaigns for e-commerce businesses to help you in measuring your marketing efforts against business goals.
Even if your campaign fails to produce expected results, it might still be worth some time and resources to learn valuable information about what worked and what did not. By taking the time, you can ensure an airtight marketing strategy for your next venture.


Leave a reply or comment below