


If you’re a business owner, you have a lot to juggle. There's content to create, marketing to organize, teams to manage — it's a long to-do list. The last thing you have time for is sifting through pages of eCommerce metrics. However, eCommerce metrics are vital if you want to grow your business. They show where you are in terms of customers and revenue, they show where you can make improvements, and they help you provide the personalized experiences customers expect.
How can you analyze all that data without it taking over your life? One solution is eCommerce dashboards. They bring together your important metrics and track them for you. You can also customize them according to your business goals.
In this article, we'll look at eight eCommerce dashboard examples you could use. But first, we'll look at what an eCommerce dashboard is and why you need one.
What is an eCommerce dashboard and why do you need one?
An eCommerce dashboard is an important eCommerce business tool. It tracks all your data in one place to give you a clear view of your business. You can customize your eCommerce dashboard to show data like:
- Sales trends
- Website traffic
- Likes, clicks, and shares
- Business growth and revenue
- Customer engagement
- Any other metrics related to your business
With an eCommerce dashboard, you’ll no longer have to trawl through vast amounts of data. You can display data in tables, graphs, and charts to make it easy to compare. You can also view it in real-time or sort it according to days, weeks, months, or even years.
It’s also easy to see where your business is struggling. For example, you might notice your social media posts aren’t getting much engagement. If that's the case, you can tweak your social media strategy and then track the results.
What should an eCommerce dashboard include?
To know what to include in your eCommerce dashboard, you need to know what your business goals are. If your goal is to increase revenue, you need metrics like revenue growth, cost per acquisition, and churn rate. If you want to reach a wider audience, you need metrics like reach, impressions, and engagement.
Most eCommerce dashboards include metrics that fall into the following categories:
- Revenue metrics
- Conversion metrics
- Experience metrics
- Traffic metrics
Let’s look at each of these metrics before we move on to eCommerce dashboard examples.
Revenue metrics
Revenue metrics show your costs and profit margins. You can see where you’re spending the most money and where you could start saving. Examples include:
- Total number of sales
- Cost per acquisition (cost of acquiring a customer)
- Revenue on advertising spent (what you earned from what you spent on advertising)
- Gross profit margin (total revenue minus costs)
- Return on investment (what you invest versus what you get back in revenue)
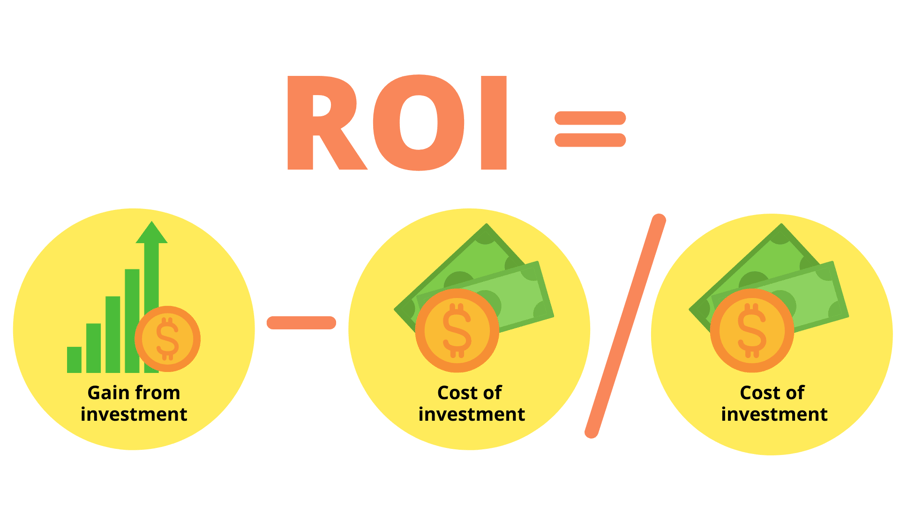
Image created by writer
Conversion metrics
Conversion metrics show how many customers are converted into sales. Conversion rate is an obvious example, but others include:
- Average order value
- Shopping cart abandonment rate (how many customers abandon their shopping cart before checkout)
- Email open rate (percentage of subscribers who opened an email)
- Click-through rate (percentage of subscribers who clicked a link)
Experience metrics
With so much competition, it's crucial your customers have a good experience. Quality of experience is quantifiable by studying metrics like:
- Customer retention rate (percentage of customers who become repeat customers)
- Customer lifetime value (revenue earned from a customer during their lifetime as your customer)
- Repeat purchase rate (percentage of purchases made by repeat customers)
- Return rate (percentage of returned items)
Traffic metrics
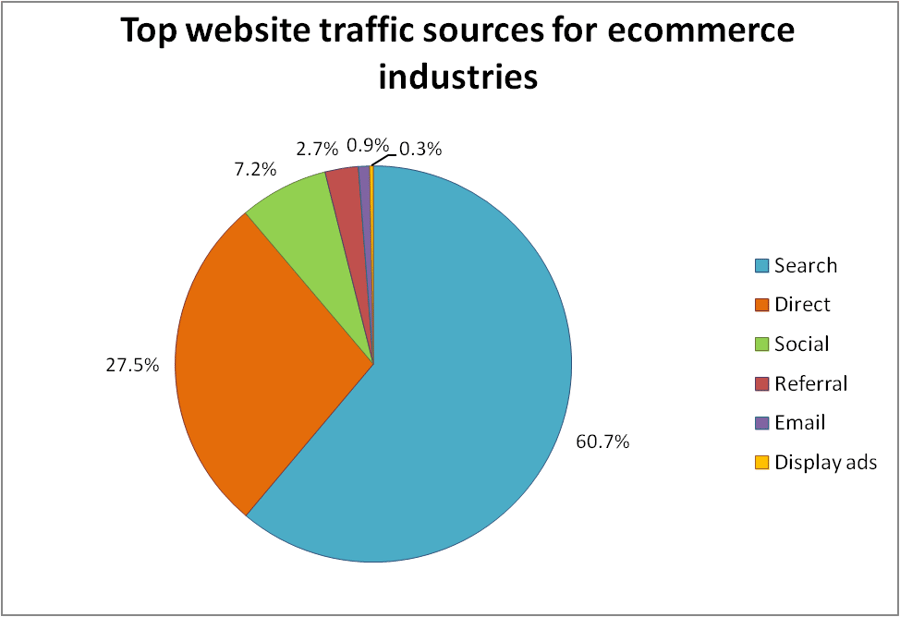
Traffic metrics show which channels bring the most traffic and revenue. They include:
- Referral rate (percentage of visitors who came to you by clicking a link on another website)
- Website traffic (how many visitors your website had in a certain timeframe)
- Organic traffic (how many visitors found you through a search engine)
- Traffic sources (how many visitors your website had from different channels)
Ecommerce Dashboard Examples
You can customize eCommerce dashboards according to your business goals and department. But here are eight eCommerce dashboard examples to get you started.
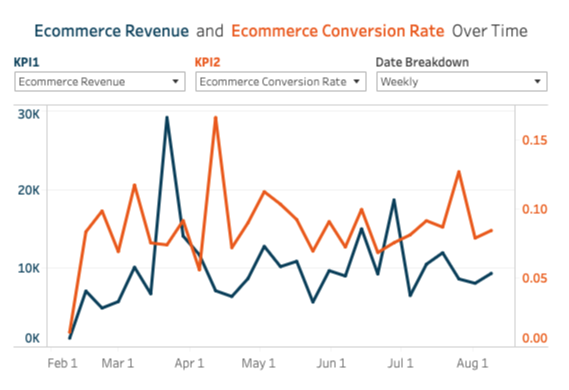
1. Website analytics dashboard
A website is still one of the best ways to reach customers. As such, you need to know how customers find your website and any pain points that stop them returning. Cue the website analytics dashboard.
A website analytics dashboard lets you track website activity and performance. It does it in real-time, too — handy if you have a last-minute meeting or web conference.
The kinds of metrics you can track with a website analytics dashboard include:
- Average website response time
- Number of page views
- Percentage of new and return site visitors
- Bounce rate (percentage of visitors who leave after viewing only one page)
- Conversion rate
- Average time on page
- Traffic sources (organic, referral, etc.)
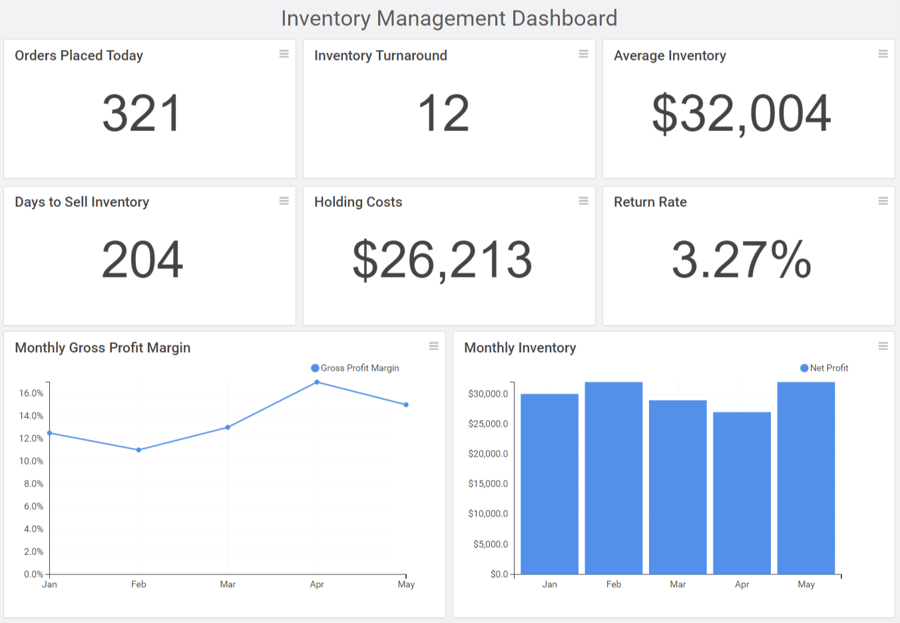
2. Supply chain dashboard
Managing supply chains is complicated. A supply chain dashboard is essential if you're going to keep track of your KPIs. They can help you with order and inventory management, meaning that you will never run out of stock. And that will keep customers happy.
A supply chain dashboard can include metrics like:
- Average order value
- Total number of orders (per week, per month)
- Order status (such as shipped, on hold)
- Current inventory
- Number of items per transaction
- Perfect order rate (percentage of orders that arrive without incident)
- Inventory turnover (number of times a year you sell your whole inventory)
3. Call center dashboard
To manage a call center, you need to know its performance. If customers are on hold too long or they’re unhappy with your audio conferencing software, you need to know. In other words, you need to track your call center metrics. A call center dashboard can track these for you so you can focus on boosting your efficiency.
Call center metrics to track include:
- Call status (the availability of each call handler to answer incoming calls)
- Call resolution (how well customer issues are resolved)
- Percentage of customers on hold
- Call abandonment rate (percentage of calls where the customer hangs up without speaking to anyone)
- Average seconds to answer
- Cost per call
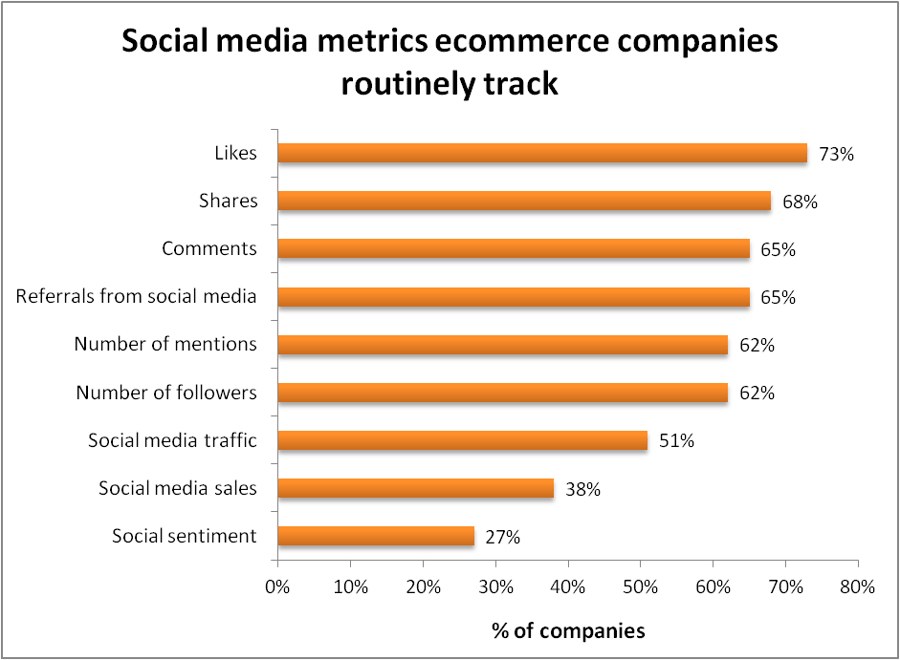
4. Social media dashboard
Social media marketing is an important channel for reaching customers. After all, nearly four billion people use social media worldwide. But when you’re trying to keep track of multiple channels, it can get complicated.
Social media dashboards give you important insights into how your content is performing across all your channels. They include everything related to your social media accounts, such as:
- Number of likes, comments, shares, and retweets
- Top performing posts
- Total number of followers
- Number of new followers
- Number of link clicks
- Engagement rate (number of interactions per post divided by the total number of followers)
- Follower segmentation (such as age group, gender)
- Reach (how many unique accounts see your content)
- Impressions (how many times your content was displayed)
5. SaaS dashboard
To succeed in the SaaS (software-as-a-service) industry, you need to have an in-depth understanding of your customers. With a SaaS dashboard, you can build a profile of your ideal customer and compare it to your real data. That way, you can see if your average CLV (customer lifetime value) is near your ideal CLV, for instance.
SaaS metrics include:
- Customer acquisition cost
- Net promoter score (how willing a customer is to promote your product)
- Customer lifetime value
- Churn rate (percentage of customers you lose each month)
- Net burn rate (how quickly a startup loses its venture capital)
- Net monthly recurring revenue (revenue from new and existing accounts minus the value of closed or redundant accounts)
6. Content effectiveness dashboard
Content marketing helps you reach customers by providing them with useful content. A content effectiveness dashboard shows how your content is performing on your website or blog. It can also show who your main audience is so you'll have a better idea of the kind of content to create.
To measure your content effectiveness, you should include the following metrics:
- Number of new subscribers
- Number of page views
- Click-through rate
- Ad impressions
- Conversion goals (for instance, how many website users achieved your destination goal of visiting a specific web page)
7. Sales performance dashboard
Sales teams have a lot of targets. It's important to know how your business is performing by tracking metrics like your online shopping cart abandonment rate. It has an industry average of 75%, so anything higher would be cause for concern. With a sales performance dashboard, you can ensure your metrics are in line with industry averages.
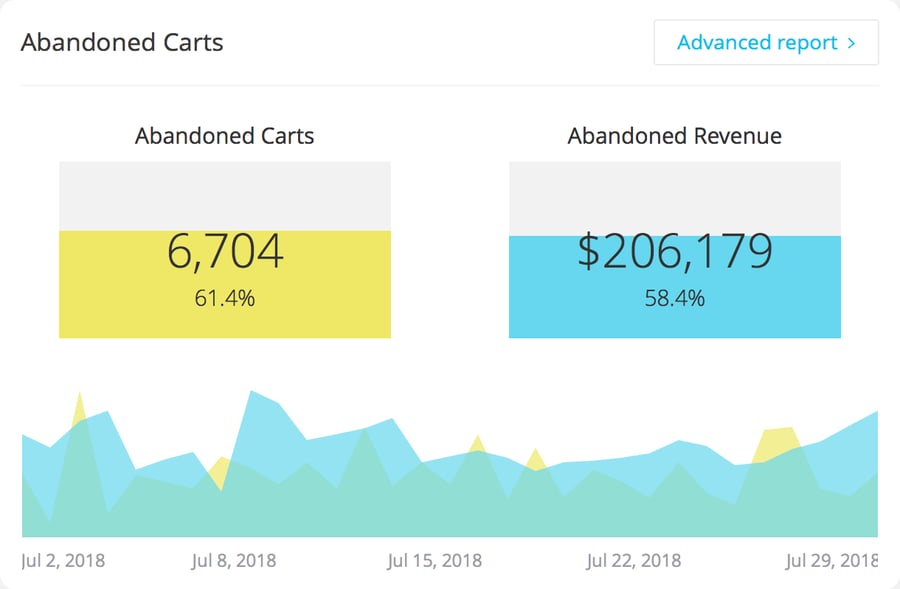
Sales dashboards can track metrics like:
- Number of completed orders
- Shopping cart abandonment rate
- Number of each item sold
- Percentage of revenue per item (such as home goods, party supplies, etc.)
- Average order value
- Percentage of sales per age group or income group
- Cost of goods sold (how much it costs to produce each item that’s sold)
8. SEO performance dashboard
Search engine optimization means creating content that ranks highly on search engines. If people are going to find your website, you need to track SEO metrics with an SEO performance dashboard. SEO dashboards can show you data like which pages are performing well and which you could improve.
The kinds of metrics you can include on an SEO dashboard are:
- SEO traffic (number of website visits from organic or paid search traffic)
- Keyword ranking (percentage of keywords your website ranks first or second for)
- Number of indexed pages
- Top performing pages
- Page load time
- Keyword density per page
- Mobile-friendly score (how mobile-friendly your website is)
- Number of links per page
How to Create an eCommerce Dashboard
The best eCommerce dashboards are a bit like the best ERP for retail. ERP (enterprise resource planning) dashboards seamlessly integrate your business processes; eCommerce dashboards seamlessly integrate your KPIs. This means you can track and visualize data without complex mental math.
How can you create a great eCommerce dashboard? Follow these simple steps:
- Identify the metrics that show if you're on track to meet your business goals.
- Find where the data you need currently is (for instance, Excel, Google Analytics, or your CRM software).
- Research the companies that provide eCommerce dashboard software and choose the best one for your business. Which company provides the eCommerce dashboard examples you want to use?
- Decide where you want to view your dashboard (on a computer, TV, or mobile).
- Import your data and design your dashboard. How do you want to display the data? There are many types of charts to choose from, so think about what would work best for each metric.
- Make sure your employees have access to your dashboard and encourage them to use it.
Your eCommerce platform of choice, like Shift4Shop, may already have a built-in eCommerce dashboard that includes automatic, real-time metrics and reports as well.
Start Tracking Data Today
In this article, we’ve looked at eight eCommerce dashboard examples that can help you track the data that is important to your business. The kind of dashboard you choose depends on your business goals and who will be using it.
Ecommerce dashboards help you save time and gain important insights into how your business performs. This, in turn, helps you improve your customer experience, which is vital in today's increasingly crowded eCommerce market.


Leave a reply or comment below