


With almost two billion users, Instagram is a social media platform that eCommerce businesses can’t afford to ignore. It’s not just the platform’s reach that makes it a vital marketing platform. Its features, such as Shoppable posts and Instagram Live, allow you to promote your products easily and interact with potential customers. Used the right way, Instagram can propel your business to success.
But the Instagram platform is constantly evolving; new features are being added as quickly as they’re being scrapped. That said, it’s essential to keep an eye on Instagram statistics and trends to stay ahead of the competition.
The following statistics provide valuable insights into Instagram, one of the three most significant social media platforms, and how it can shape your Instagram marketing strategy.
1. General Instagram Statistics
Before diving into more granular social media data, let’s establish some important facts about Instagram. Below are some general statistics you should know about the platform.
Instagram is the 4th most active social media platform.
Approximately 1.318 billion Instagram users were active in January 2023, behind WhatsApp, YouTube, and Facebook. However, its active user rate steadily declined over the past three months. Due to Instagram’s 13+ age limit, its eligible user rate is likely higher than reported.
Instagram is the 5th most visited website globally.
Instagram gets over 6 billion visits per month, with visitors spending at least eight minutes on the website. Although this puts it behind platforms like Facebook, the number is still impressive, allowing you to reach millions.
2. Instagram User Statistics
As Instagram usage has grown over the years, you must understand how people perceive and utilize the platform. The following trends provide a snapshot of Instagram user statistics.
India and the United States have the highest global user base.
Instagram has a global audience with roughly half — 893 million users — coming from the Asia Pacific region.
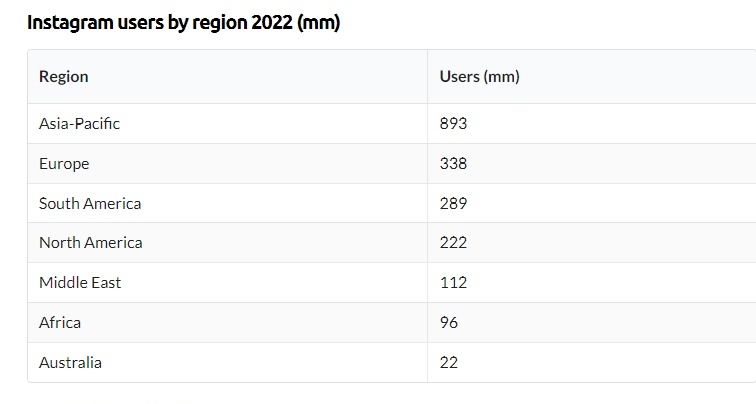
Source: BusinessofApps
One of the most prominent Instagram markets is India, which has 229.5 million active users, followed by the United States, with 143.3 million.
If your eCommerce business caters to a global audience, this information will help you better define your target audience and know the regions to focus most of your ads spend.
Young adults and millennials have the highest distribution of Instagram users by age.
Instagram is most popular among younger audiences. Among Instagram users, people aged 18-24 account for 30.8%, followed by those aged 25-34 at 30.3%.
Notwithstanding, this report by Forrester suggests there’s still hope for businesses targeting a much younger audience on the platform. The report shows 61% of users aged 12-17 use Instagram weekly. That’s great information if you’re marketing to younger shoppers.
Only 25% of U.S. users are confident the platform protects their privacy and data.
Trust in social media platforms declined significantly in 2022. Among American users, only 25% feel that Instagram protects their privacy and data, a decline of 9% from 2021, making Instagram one of the least trusted social media platforms.
However, it still has a significant lead over Facebook, Twitter, and TikTok.
Only 0.1% of Instagram users are unique to Instagram.
The likelihood that an Instagram user has another social media account is 99.9%. Users often combine Instagram with social media platforms like YouTube (75.5%), Facebook (82.9%), and TikTok (52.2%).
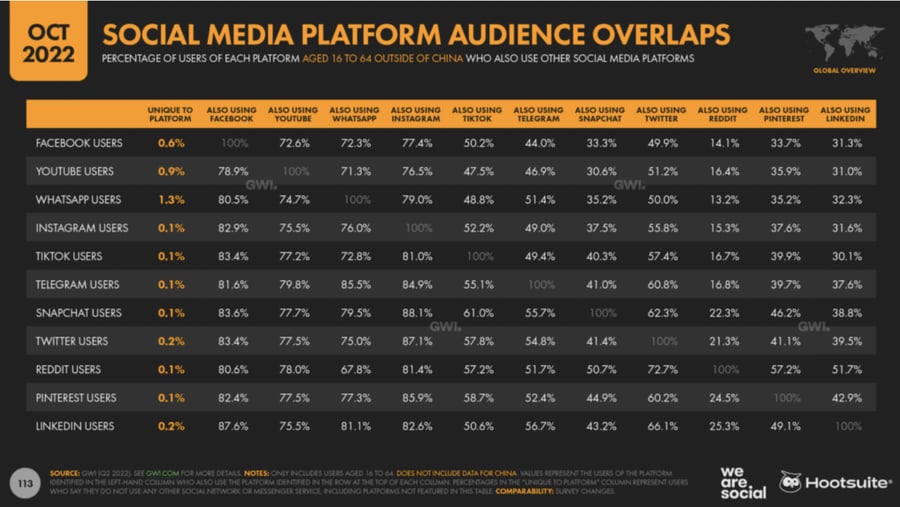
Source: Hootsuite
Therefore, ensure your brand has a unique content creation strategy to amplify your cross-platform or omnichannel marketing efforts.
Instagram’s audience has more males than females.
Instagram has 52.2% male users, leaving female users at 47.8%. This is a shift from previous years when women slightly dominated the platform.
The platform is a great place to reach a diverse audience, regardless of gender.
3. Instagram Engagement Statistics
Video content has become increasingly popular on Instagram thanks to the platform’s focus on promoting it. In addition to images, users interact with Reels, Stories, and user-generated content (UGC). The following Instagram statistics show the potential for social marketing content to increase engagement.
Videos with an average of 26 seconds get the most comments.
While Instagram allows you to upload 1-minute video clips on your Instagram feed posts, it’s best to keep them shorter. HubSpot discovered this video engagement trend by cutting their original State of Inbound video (on YouTube), which was two and half minutes long, into 30 seconds to meet their Instagram audience expectations.
If you must upload longer videos on Instagram, consider using Reels or a different platform like YouTube to retain engagement.
Instagram carousels get more engagement than one-post images or videos.
Brands with more prominent Instagram profiles receive more engagement per post. However, social media analysts reveal carousel posts outperform standalone videos and images by 1.65% to 5.4%, depending on the number of followers.
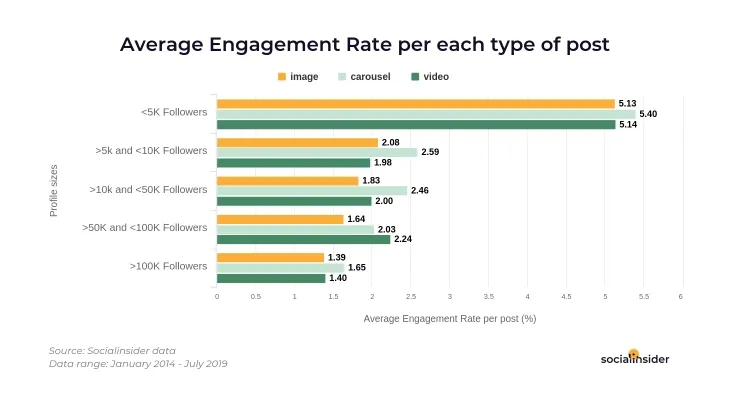
Source: Social Insider
Combining multiple photos or videos into a carousel increases the chances of user interaction and time spent viewing your post. For best results, use up all ten slides (maximum slides in a carousel) for a higher engagement rate on Instagram.
Nonetheless, you must improve your Instagram profile with effective social media branding to boost visibility on the platform. Using a generative AI tool to develop ideas for your videos and Instagram Reels can also be an effective way to increase engagement with your target audience.
4. Instagram Stories Statistics
Snapchat might have pioneered the Stories feature, but over twice as many users have hopped the feature’s bandwagon on Instagram since its debut. This points to the potential of Instagram Stories for eCommerce brands for engagement and social ad purposes. Check out these Stories statistics to inform your social media marketing strategy.
Half a billion users view Instagram Stories daily.
More than 500 million users view branded Instagram Stories daily. This makes it an excellent way for eCommerce brands to reach their target audience.
You can also use several built-in interactive elements like stickers and GIFs to make your content more engaging and creative. For example, with the link sticker, you can direct users to a relevant page on your online store.
Instagram Stories with six frames per day have a 75% retention rate.
Although more brands are using Stories in their marketing, they’re not posting significantly higher frame counts. Higher frame counts don’t necessarily equate to a greater retention rate.
According to Rival IQ, you’re likely to see a retention decline when you post only one or two frames per day. However, the decline in viewership slows down and stays at 75% until you post six frames per day.
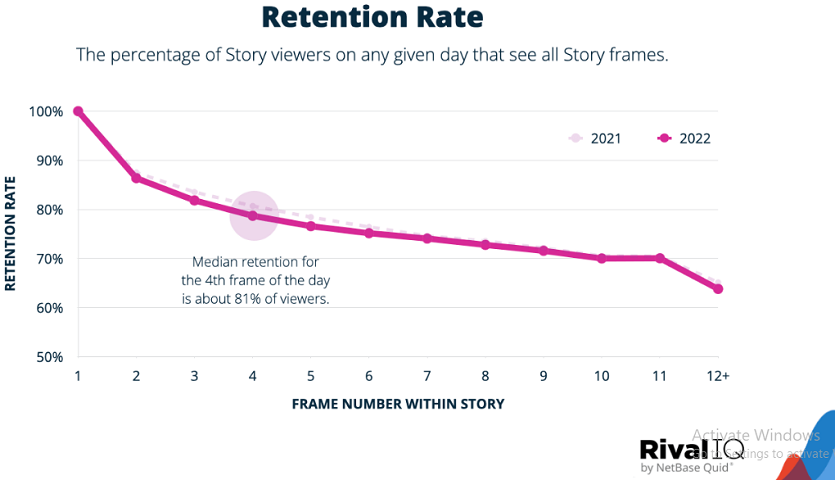
Source: RivalIQ
This suggests that posting up to six frames a day doesn’t have a significant negative impact on retention, but post much higher, and you might lose viewership.
For your brand to succeed, determine the right number of frames per day while considering other factors such as quality and relevance of content, posting frequency, time of day, and your audience.
Consumers prefer short narrative story formats.
Despite some research suggesting that Stories with interactive features like polls, quizzes, and questions are more popular among viewers, data from Lucid Software, conducted by Hubspot, indicates otherwise.
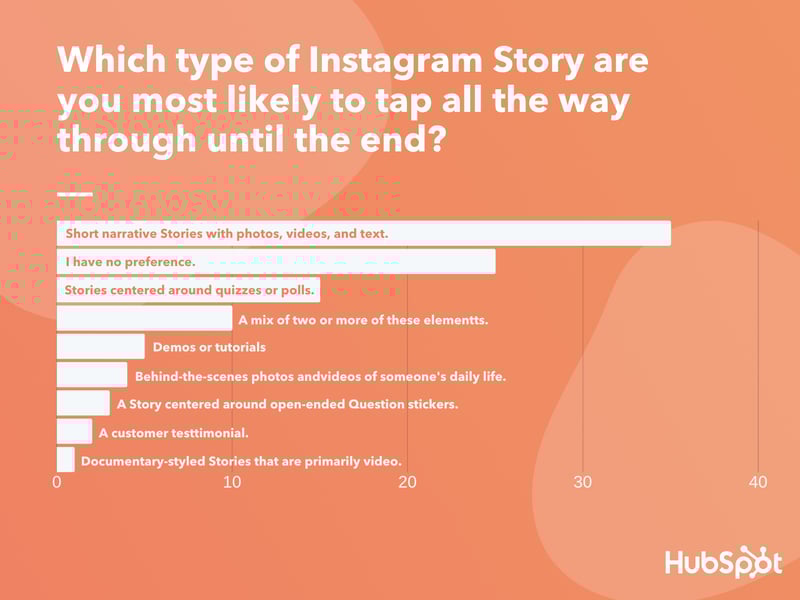
Source: HubSpot
In the study, 35% of respondents preferred short narratives, which included photos, videos, and text. Quizzes and polls were another popular option, taking 15% of the votes.
5. Instagram Business Statistics
There’s more to benefit from Instagram if you plan to expand your business online. From product tagging to shoppable feeds, here are Instagram statistics to show you the value of having an Instagram business account.
The No. 1 social media platform for building relationships with brands is Instagram.
According to a Meta-commissioned Ipsos Marketing study, “people surveyed said Instagram is the best place to keep up with their favorite brands compared to other platforms.”

Source: Instagram
Although the stat might be open to interpretation, it shows that people interested in your brand expect to find you on Instagram.
Seventy percent of shoppers look to Instagram for their next purchase.
Instagram internal data reveals that 70% of shoppers look to the platform for purchase inspiration and to discover new products. This is your cue to open Instagram Shops and build a community of loyal customers.
Instagram Business account posts have an average engagement rate of 0.65%.
If you’re beating that benchmark of 0.65%, pat yourself on the back. It skews higher on video posts (0.66%) and carousels (0.76) and lower on photos (0.59%).
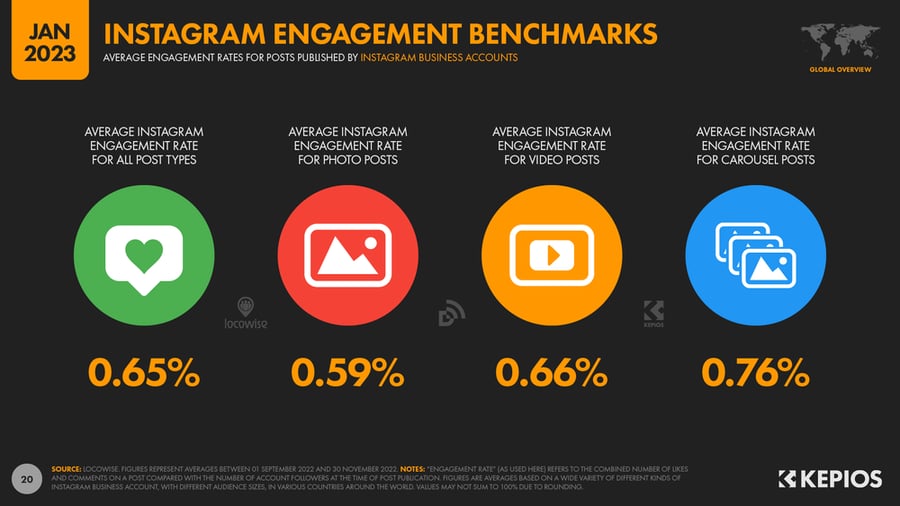
Source: DataReportal
Engagement rates also change with the number of Instagram followers a brand has. As the following grows, Instagram engagement rates typically decline. Compared to brands with more than 100K followers, business profiles with fewer than 10K followers had higher engagement rates.
6. Instagram Advertising Statistics
The total population of people Instagram can reach with ads is 1.32 billion people, and although the total number keeps decreasing, it doesn’t mean you should throw in the towel yet. Explore other options. For instance, you can focus on boosting your follower account while establishing your Instagram presence. This could positively impact your advertising efforts and increase visibility.
Here are some Instagram statistics to inform your advertising campaign.
Stories ads have a lower click-through rate (CTR) than feed ads.
Advertisements between Stories and sponsored posts in the main feed get different user interactions.
According to Brafton, Instagram feed ads have a CTR of 0.22% to 0.88%, while Stories ads have a CTR of 0.33% to 0.54%. This suggests that in-feed ads are more likely to drive clicks than Stories ads. If you want to see which ad placement works best for your audience, experiment with different placements.
Fifty percent of people become interested in a brand when they see their ads on Instagram.
Approximately 50% of Instagram users become more interested in a brand after viewing an ad on the app. This proves the power of advertising on Instagram.
Instagram ads’ CPM increased by 17% since the third quarter of 2022.
Instagram’s CPM (cost per 1,000 impressions) has risen by 17% since Q3 2022, making it more expensive to run ads. According to insights from various sources, as gathered by Insider Intelligence, advertisers are moving to relatively less expensive platforms like TikTok to cut down on ad spend.
If you want to leverage Instagram’s audience reach, making informed decisions by understanding your audience persona is essential. Every impression counts.
7. Instagram Reels Statistics
Instagram moved beyond a photo-sharing app to becoming a video-sharing app and marketplace. Here are some Reels statistics to consider if you want to take full advantage of what they have to offer.
Reels have x2 the average engagement rates of other Instagram post types.
Reels have an average engagement rate of 1.95%, with Instagram accounts of 10k to 50k followers experiencing a 2.24% average engagement rate. This slightly declined since 2021, when the average engagement rate was 2.41%.
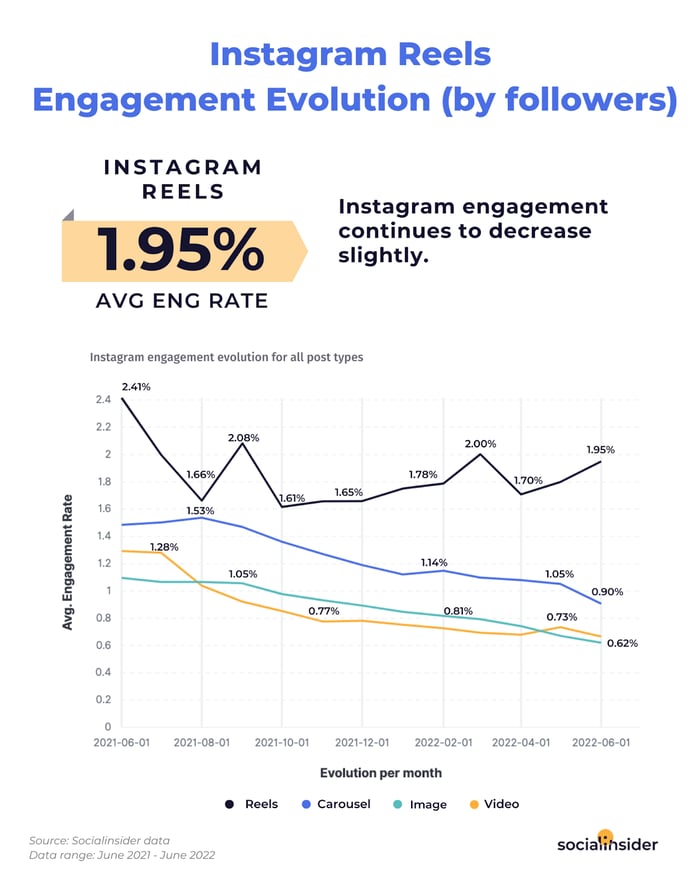
Source: Social Insider
The most effective way to utilize this information is to dive into the data and mix all content types throughout your Instagram marketing campaigns.
Instagram users spend 30% of their time watching Reels.
According to a Forrester report, the time spent watching Reels has increased since Meta’s Q2 2022 earnings call.
What does this mean for you? Now may be the best time to leverage Reels’ short-form video content in your marketing strategy. But even as you invest in an Instagram Reels strategy, you should augment it with other video-sharing platforms for better results.
Final Thoughts: Making the Best of Instagram
More brands will continue building their presence on Instagram even as more features are released. Due to Reels’ growing popularity, eCommerce brands stand to gain the most with highly interactive visual shopping features and skyrocketing engagement rates.
Create a robust strategy based on these Instagram statistics to inspire consumer purchases and buying decisions.


Leave a reply or comment below